Model Output: Charts and meteograms based on the output of numerical weather models
Wind / Precipitation Charts
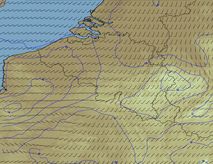
Wind charts contain detailed wind speeds for Belgium and the surrounding areas, based on model output. Wind speeds are expressed in knots. These wind charts are available for different heights: 10m, FL020, FL050 and FL100.
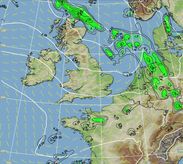
Precipitation charts contain total precipitation rate, wind speeds barbs and isobars for Western Europe at surface, based on model output. Precipitation rate is expressed in millimeters per hours, wind speeds in knots and pressure in hectoPascals.
The model also provides an evolution of the wind until T+48. You can easily visualise the changes of the wind through the animation buttons.
Meteograms
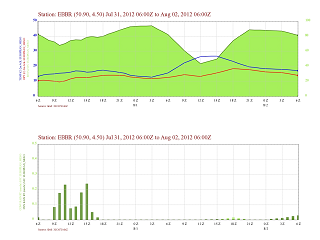 An easy way to look at a time series of meteorological data at a particular location is by plotting this data in a "meteogram." In a meteogram, time progresses from left to right across the figure. One or more meteorological parameters can be plotted, either as line graphs, bar graphs or even symbols. Using a meteogram, one can get a feel of how conditions will change and evolve at a stationary point.
Keep in mind that like all the other model forecast information provided by us, these data are "as is". They are straight from the computer models, no interpretation, corrections, or other objective or subjective changes have been made. These are not the "official" forecasts, though in most cases they should resemble those rather closely.
The following meteorological parameters are represented on forecast meteograms:
- Temperature
- dewpoint
- relative humidity
- wind speed
- wind direction
- dynamic and convective rain rate
- dynamic and convective snow rate
- mean sea level pressure
- visibility
The meteograms are updated twice daily (09:30 and 21:30 Z) and give a forecast of the above parameters for the next 24 hours.
Cross-sections
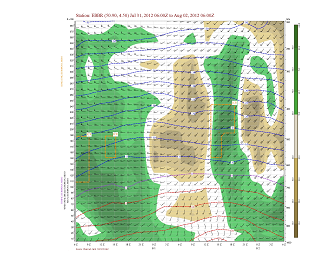
These products are updated four times per day (03Z, 09Z, 15Z, 21Z) and give a forecast of the above parameters for a single location projected for the next 48 hours.
Soundings
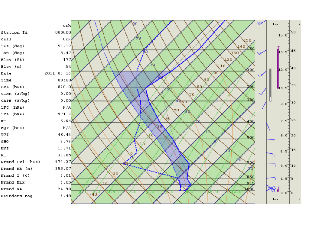 Forecast Soundings give the vertical distribution of the physical properties of the atmospheric column for a single time and location.
The source data is from a Numerical "Mesoscale" model which is updated 4 times daily.